Accounting Dashboard
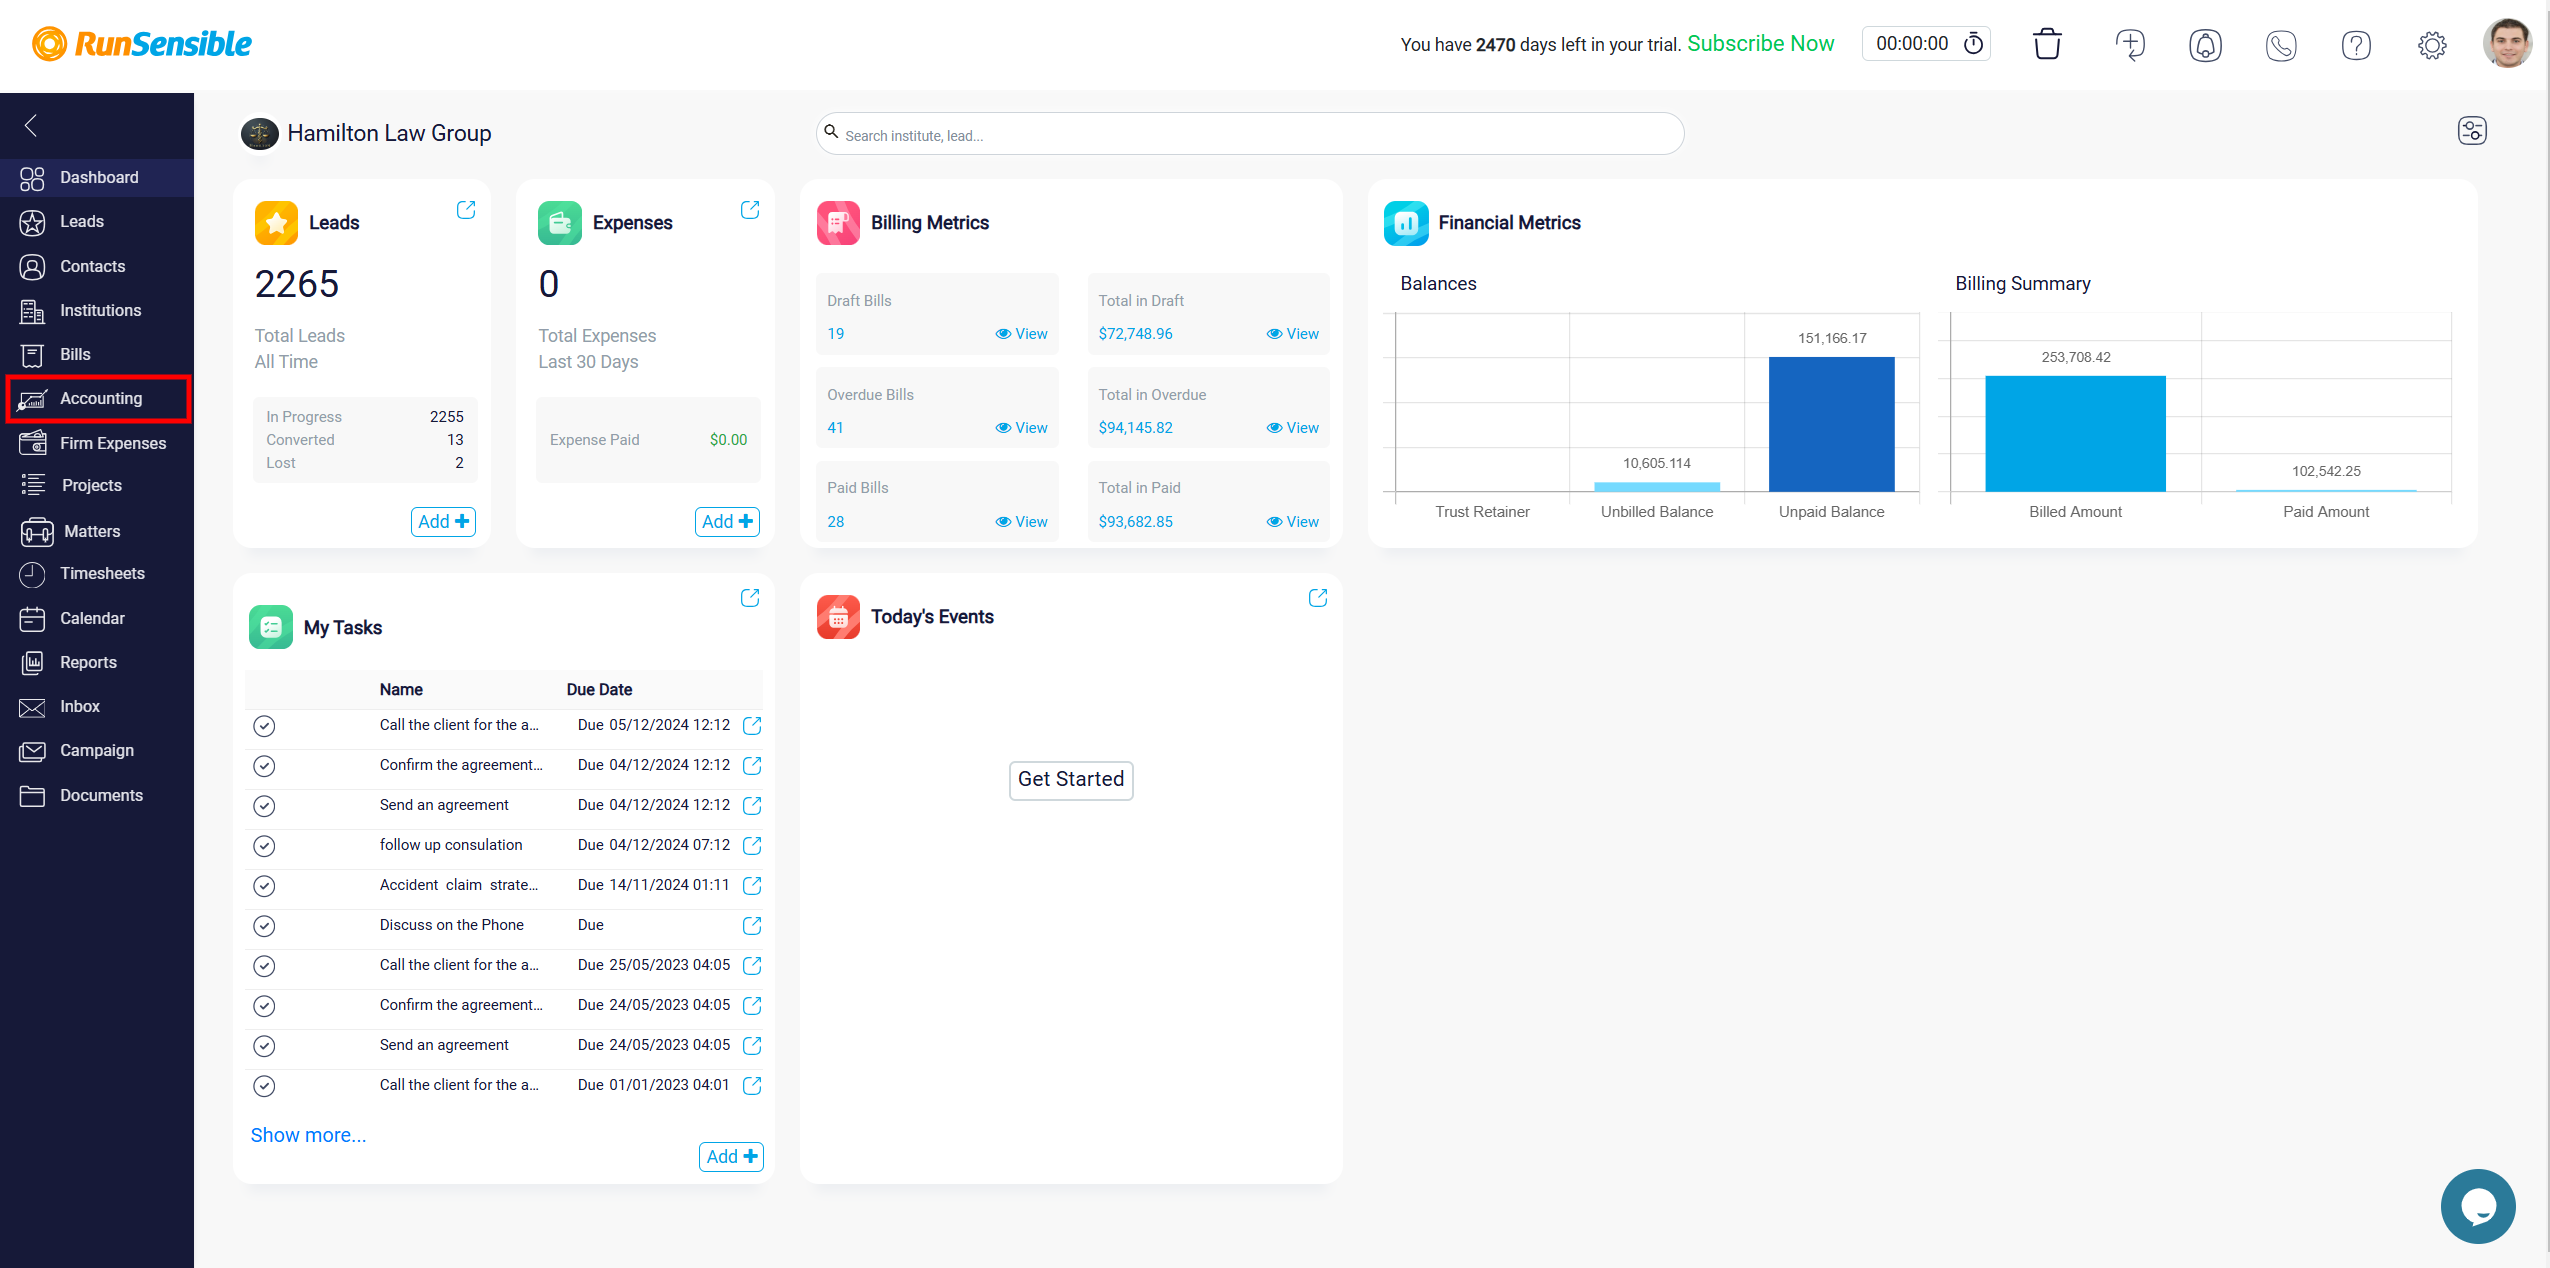
To begin managing your finances in RunSensible, start by clicking on the Accounting option located in the left-side menu.
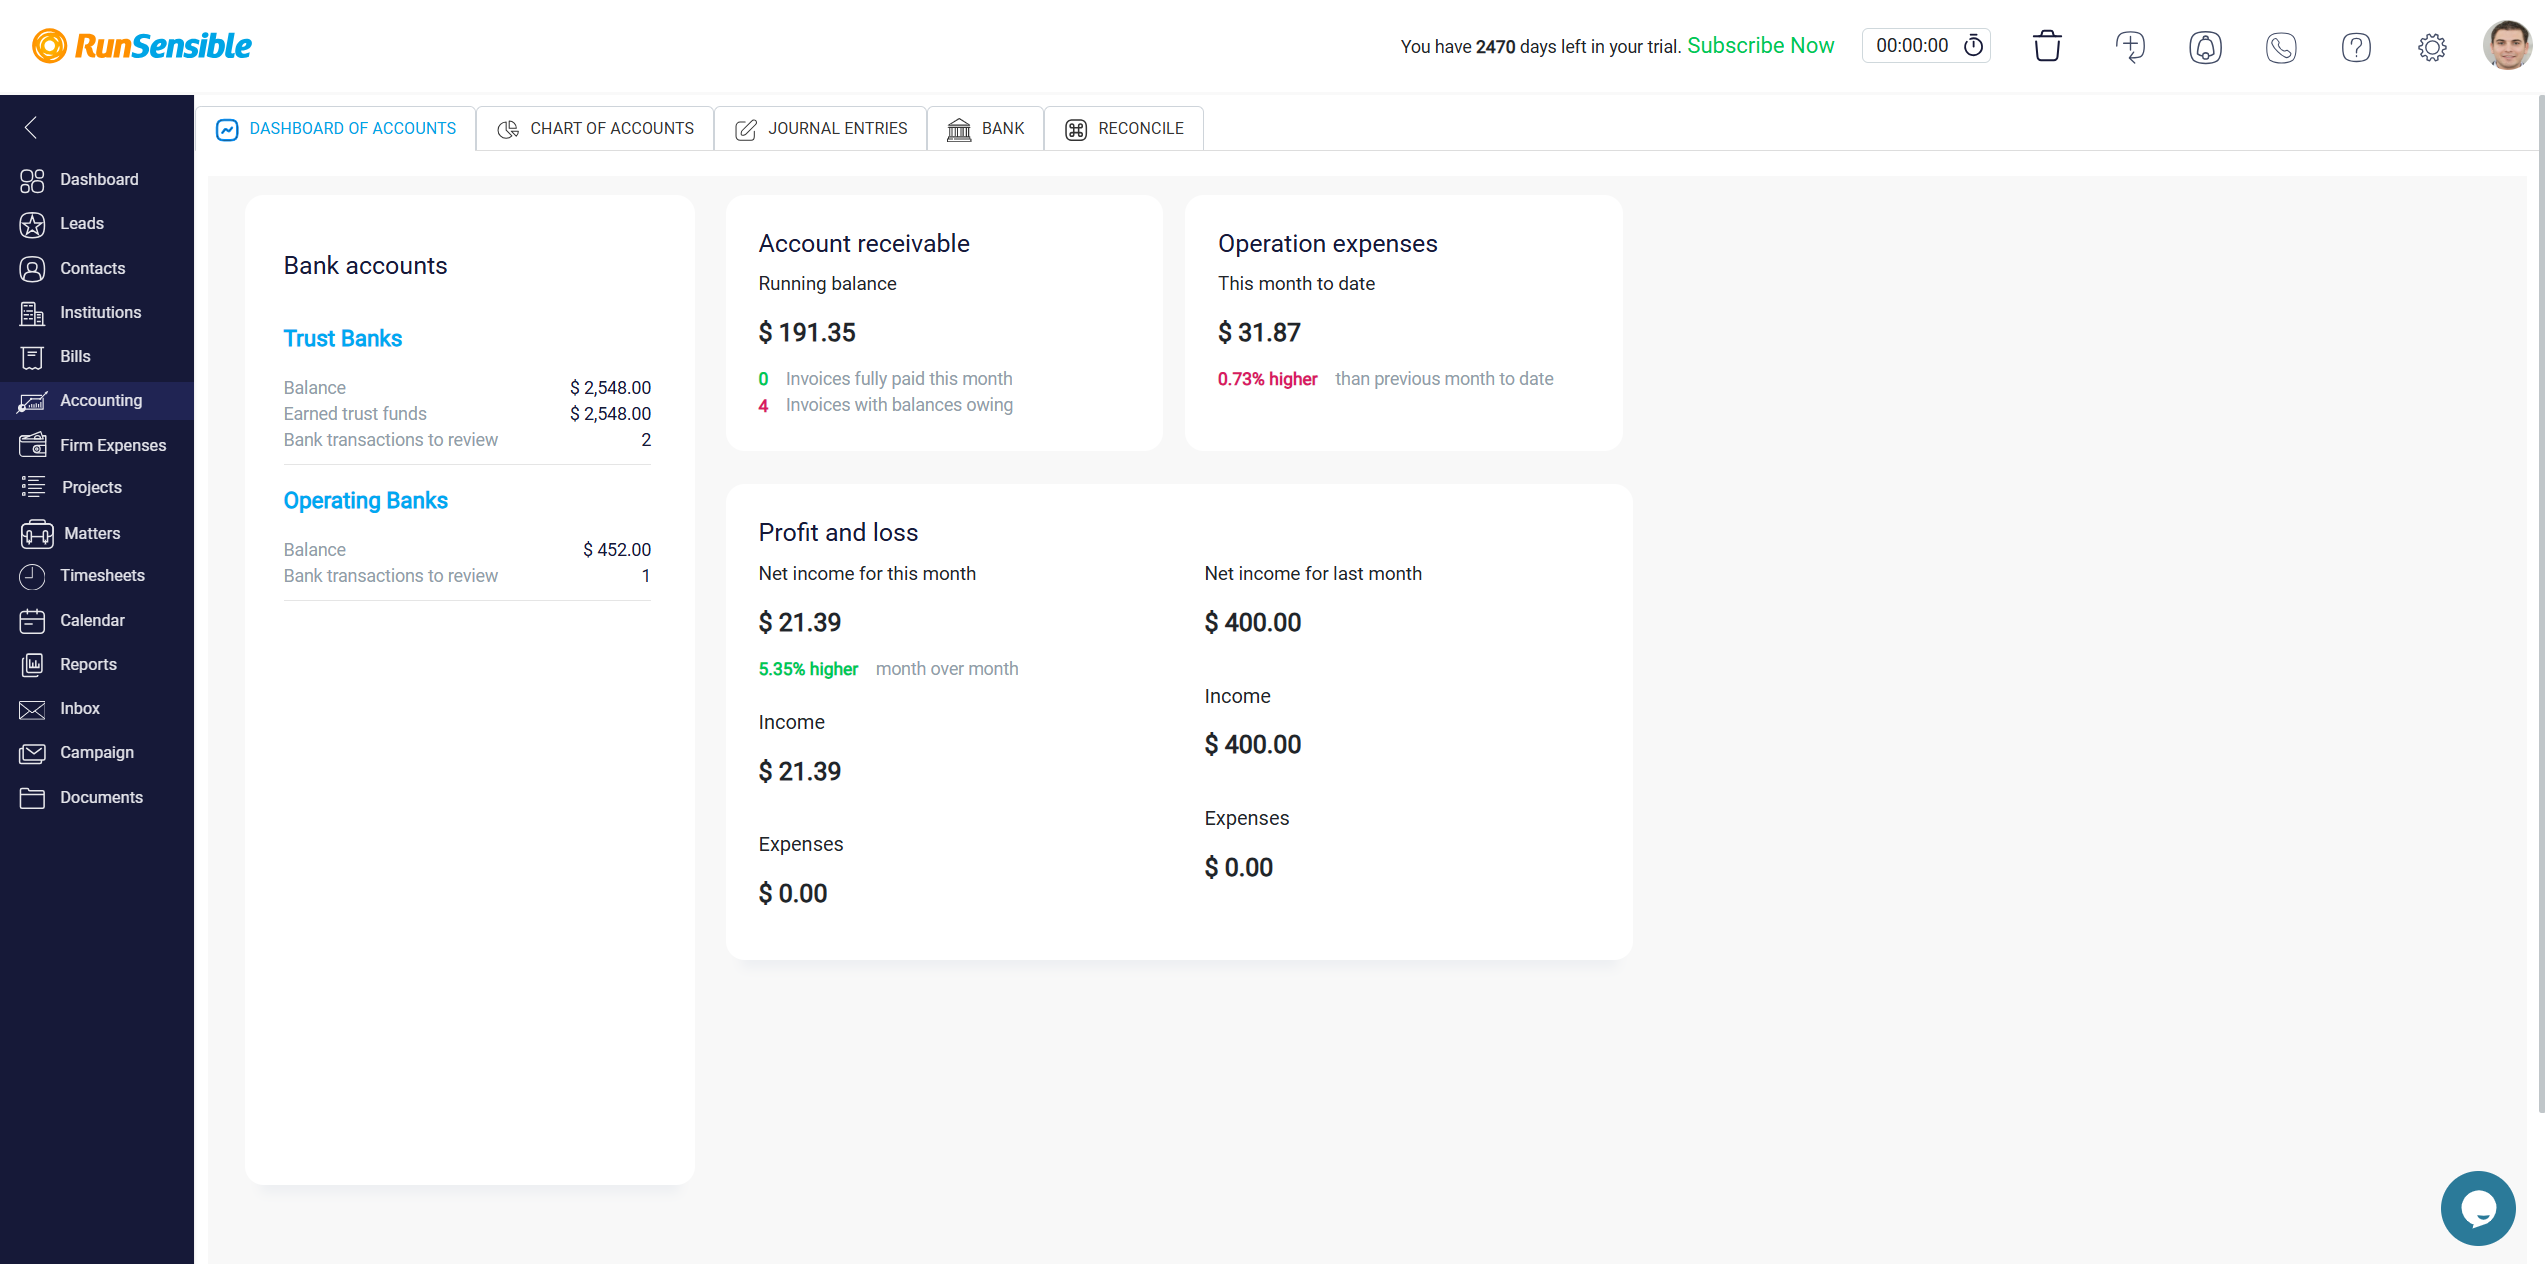
This will take you to the Dashboard of Accounts, a structured and organized space where you can view and manage the financial data of your company. The dashboard is divided into several sections, each dedicated to a specific aspect of your finances, allowing you to access and understand the key details of each financial component.
Bank Accounts section
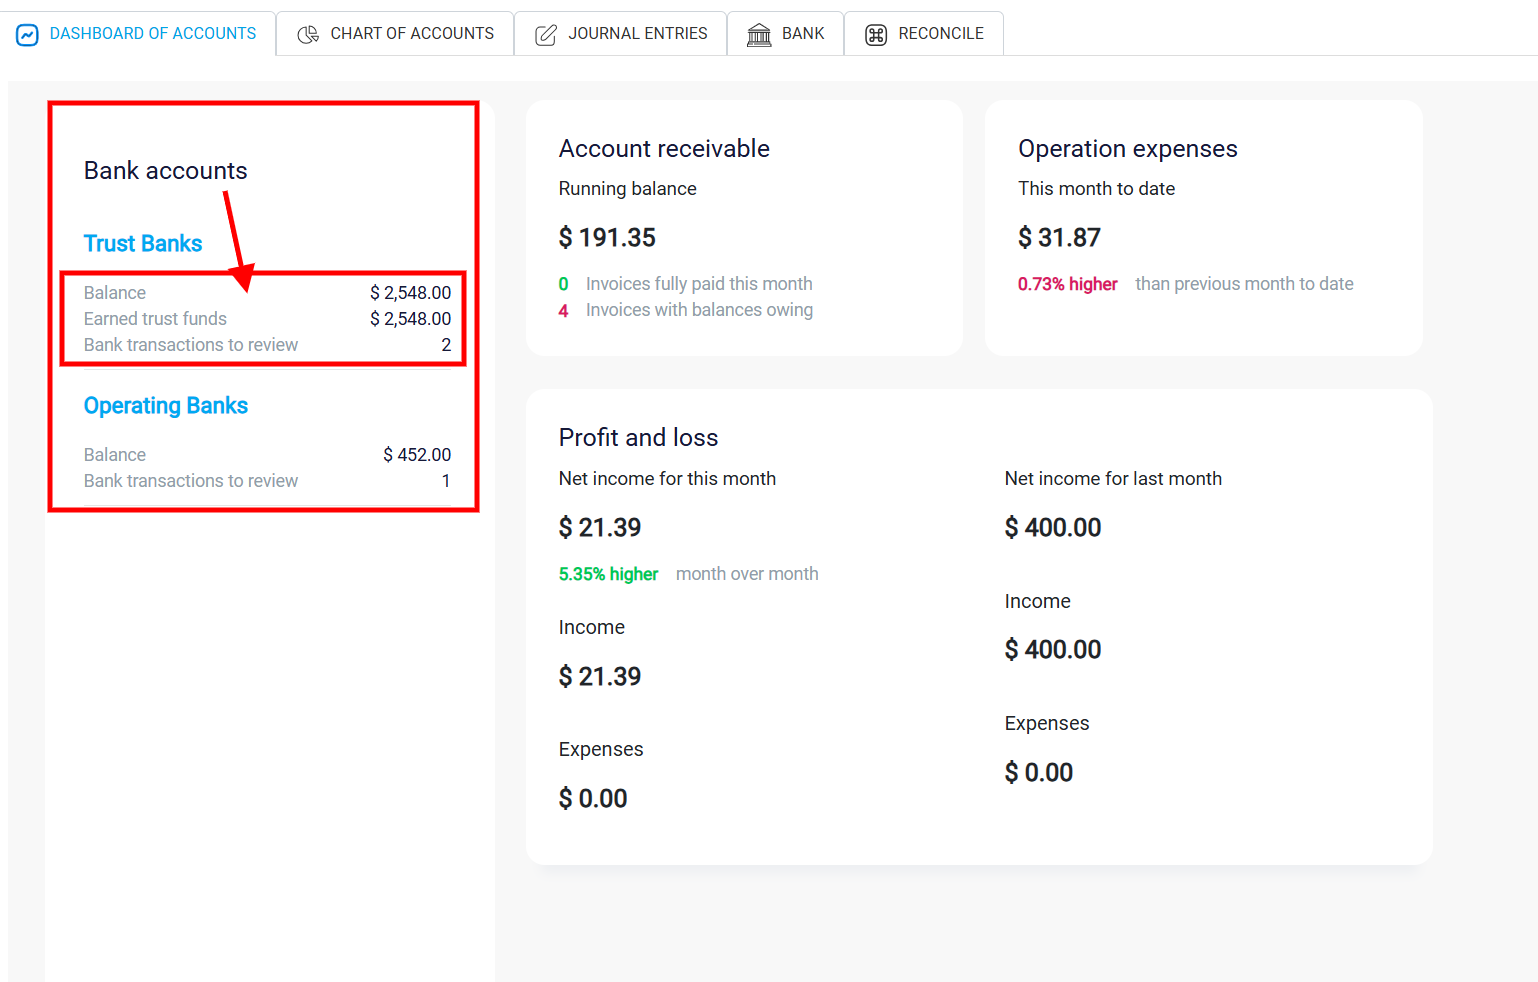
In the Bank Accounts section, the dashboard displays the balances of different bank accounts, including the Trust Bank and the Operating Bank. For each account, you can view the current accounting balance, which reflects the total funds available or any liabilities if the balance is negative. Additionally, the Earned Trust Funds line provides information on any accrued trust funds within each account. A label indicating Bank transactions to review identifies transactions that are not automatically categorized or matched to existing entries. It also provides an opportunity to classify transactions correctly, avoiding discrepancies in financial records. This feature provides transparency regarding the reconciliation history, helping you understand the status of each account.
Account Receivable Section
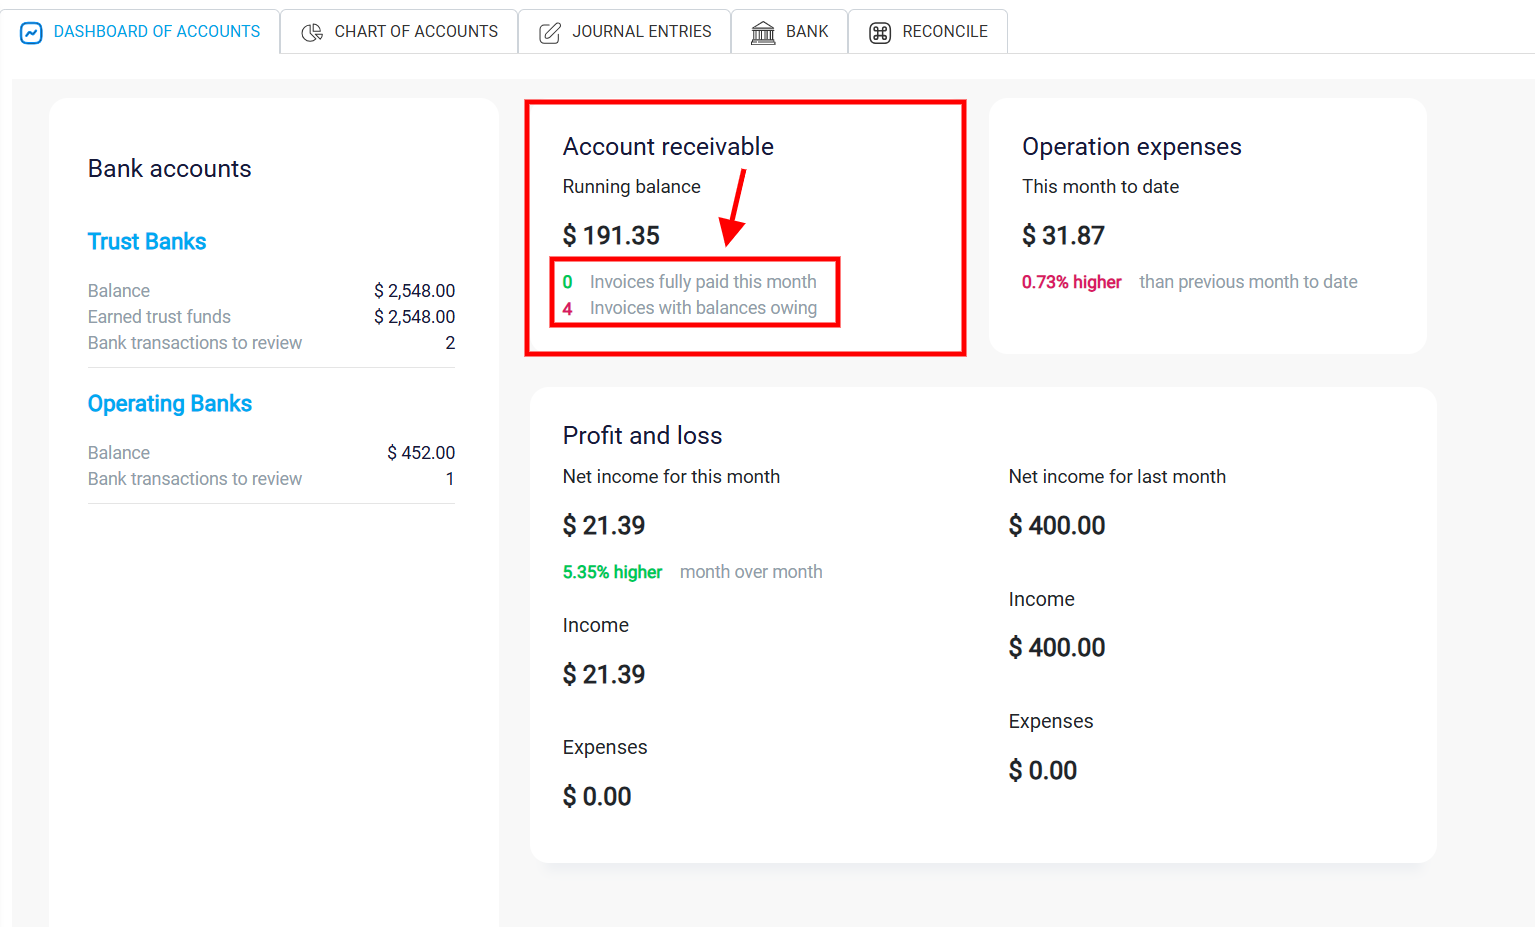
The Account Receivable section provides a clear summary of the money owed to your company by clients. The Running Balance figure represents the total amount of unpaid invoices, offering a quick view of outstanding receivables. Below this, two additional indicators specify the status of invoices: one displays the number of invoices that have been fully paid within the current month, while the other shows the count of invoices with remaining balances. This section offers a straightforward snapshot of expected income from clients, allowing you to monitor cash inflows effectively.
Tracking Operational Expenses
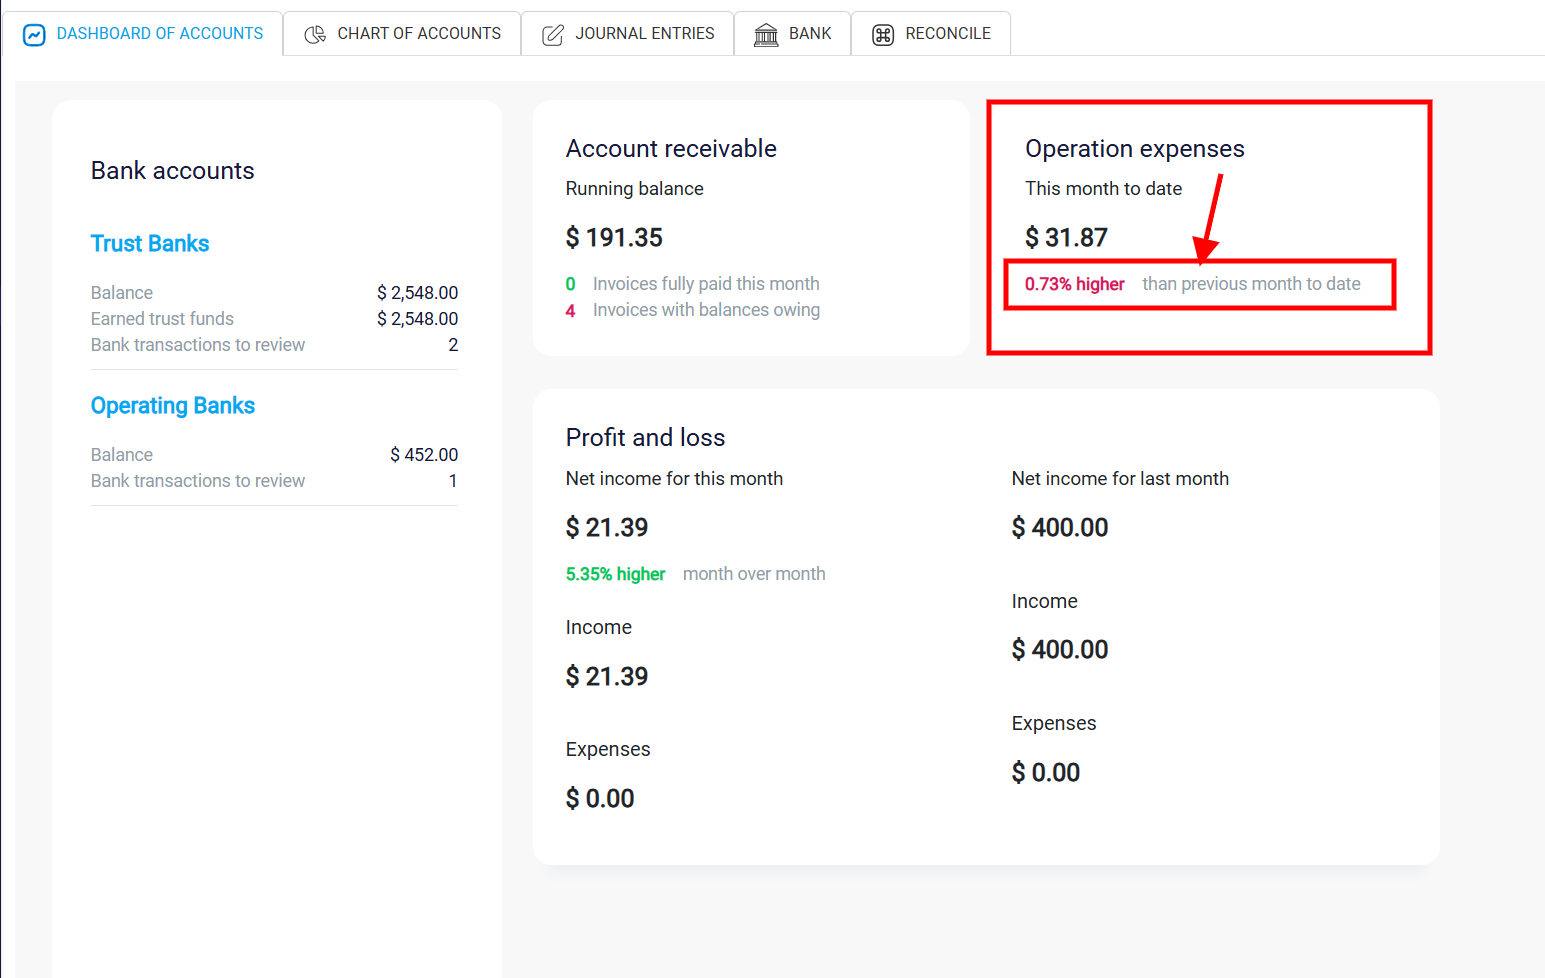
The Operation Expenses section tracks the company’s expenses for the current month, giving insight into your spending patterns. It shows the cumulative amount of expenses incurred so far, enabling you to monitor operational costs closely. A percentage comparison with the previous month is included, highlighting any changes in expenses. If this percentage is positive, expenses have increased compared to the same period in the previous month; if negative, expenses have decreased. This comparison provides a quick understanding of monthly expense trends, helping you manage and forecast operational spending.
Analyzing Profit and Loss
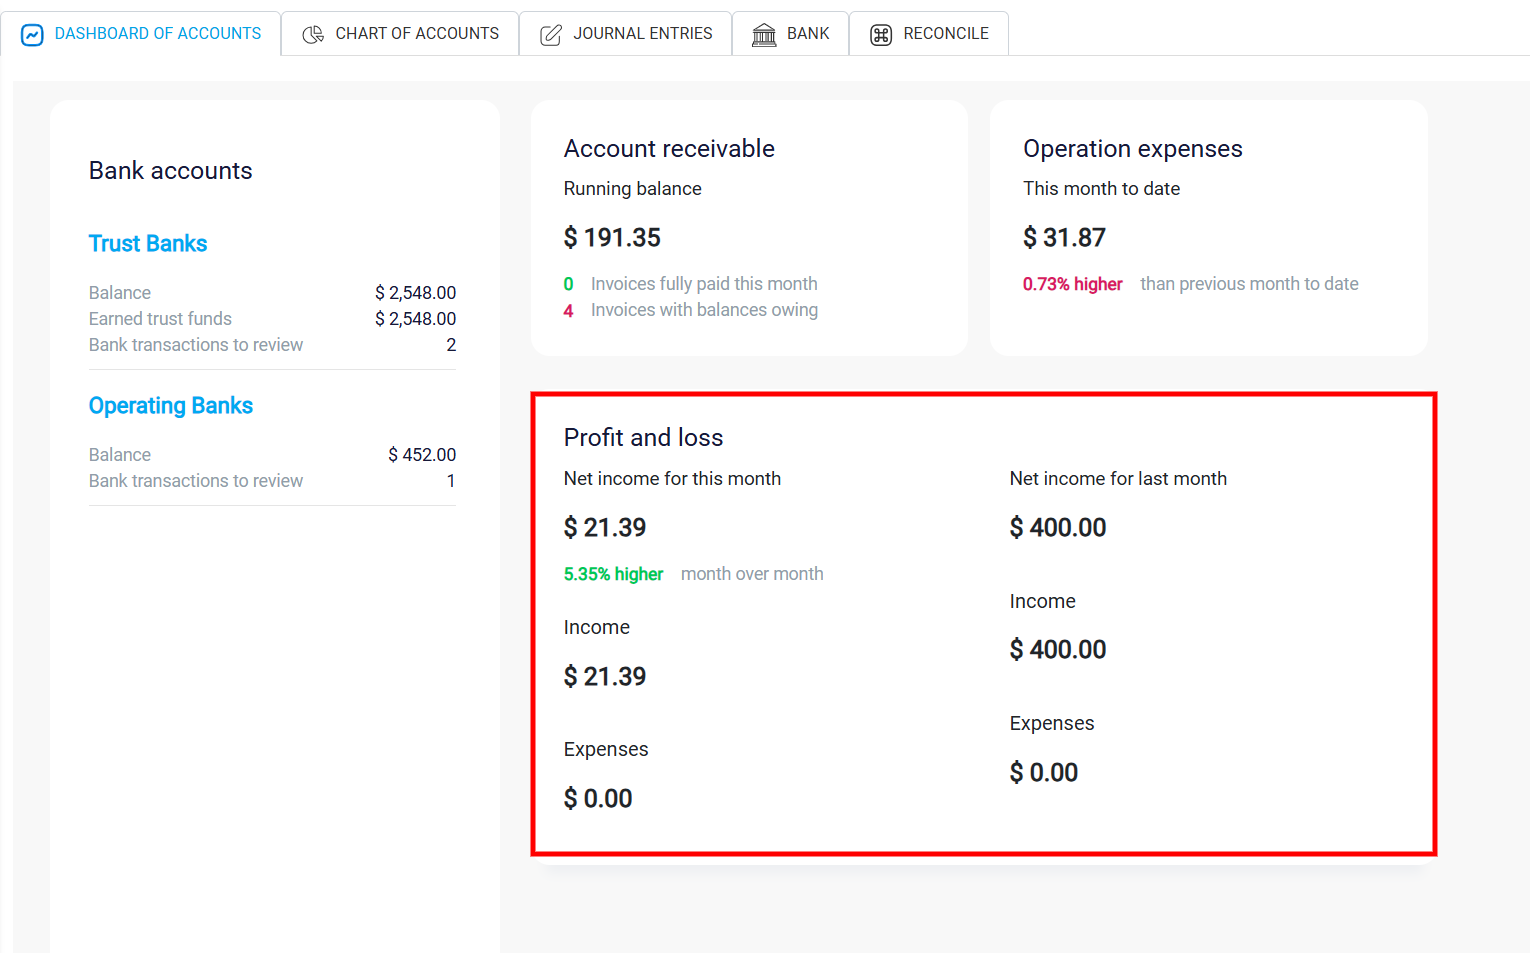
The Profit and Loss section provides a summary of your firm’s financial performance, displaying net income, income, and expenses for both the current and previous months. The Net Income for the current month is prominently displayed, indicating the company’s overall profitability or loss. Alongside this, the income and Expense values show the total revenue and costs recorded for the period. A month-over-month percentage change in net income is also presented, showing the difference from the previous month. This section is valuable for evaluating the firm’s financial health over time, allowing you to track whether income and expenses are stable, increasing, or decreasing.
